One of the cool things you can do with Tableau is define every pixel from an image. This allows you to create interesting visualizations as described below.
Before we get started, let’s first understand some fundamental concepts about digital images.
DIGITAL IMAGE
A digital image is a matrix made out of pixels (the smallest element on a screen). In the figure below we present an image of fruits and vegetables. It can be observed that when we zoom into a portion of the image, it is no longer smooth, but made out of individual squares. Each square is known as a pixel. The size of the image is defined by the number of pixels it has in width and height. The original image below is made out of 1577 x 852 pixels in the width and height, respectively. Therefore, it has a total of 1,343,604 pixels. The more pixels an image has, the better its resolution. The drawback is that the file size is also larger.
Each pixel has 3 values used to represent the color. The 3 values represent the amount of Red, Green and Blue, also known as RGB. There are 255 possible values that can be used to represent each of the RGB values. The image below shows the amount of red, green and blue used for the original image, and we also show a grayscale version of the image. A grayscale image can be obtained by making the values of the RGB the same.
WORKING WITH TABLEAU
Tableau allows us to define a data point based on its row and column location. When we view a digital image, each pixel is located at a specific row and column. In the example below we present an image made out of 4 columns and 3 rows (12 pixels in total). We also made each pixel grayscale with a different value between 0 (black) and 255 (white).
CONVERTING AN IMAGE INTO ROWS AND COLUMNS
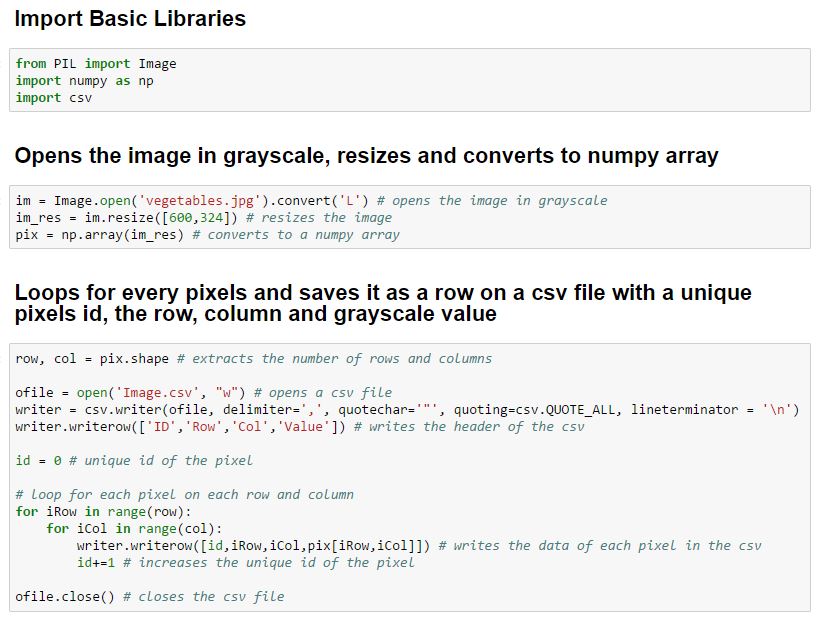
To get an image into Tableau we need to create a file format that describes three parameters the row, column and grayscale value of each pixel. To do this we can use software tools like Python. Below is a simple script that loads an image, converts it into grayscale, resizes the image, and saves the row, column and grayscale value into a csv file. We do not have to resize the image, but in some cases we can apply this to reduce the total number of pixels in the image. In this example, we change the image size from 1577 x 852 to 600 x 324. Note that we roughly maintain the ratio of width/height so the image does not deform.
The output csv has the following form:
VISUALIZING WITH TABLEAU
We can now bring the csv file into Tableau and we can:
Move the “Row” measure to Rows
Move the “Column” measure to Columns
Move the “Value” measure to Color
Uncheck the “Aggregate Measures”
Note that the row values are in reverse order; therefore, in the y-axis we need to “Edit Axis” and check “Reversed”.
We can then format the image as shown below. We can observe from the tooltip of the figure below, that we can have information about specific pixels.
Finally, with some clever manipulation we can expand the above concept and create images based on text as shown below. Here is another great example from Karen Hinson, and a great blog post from Ken Flerlage who describes a method of extracting an image into a Tableau friendly format without writing code.
Hope you find this useful!


